Significance and Application
One application of Pascal's triangle is the binomial theorem. To get to the theorem, we first need to cover what a binomial is. A binomial expression is an expression that contains two terms. Examples would be \(2x+y\) or \(5m-7n\). Suppose you need to expand the binomial \((a+b)^2\). The natural response would be to multiply each term in the first binomial by each term in the second, giving you \(a^2 +ab+ab+b^2 = a^2 +2ab+b^2\). Observe the following characteristics about this expansion:
- "As we move through each term from left to right, the power of a decreases from 2 down to zero.
- The power of b increases from zero up to 2.
- The coefficients of each term, (1, 2, 1), are the numbers which appear in the row of Pascal's triangle beginning 1, 2.
- The term \(2ab\) arises from contributions of \(1ab\) and \(1ba\), i.e. \(1ab + 1ba = 2ab\) This is the link with the way the 2 in Pascal's triangle is generated; i.e. by adding 1 and 1 in the previous row" ("Pascal's Triangle", 2009).
To generalize this, the coefficients of the binomial expansion \((a+b)^n\) will come from the nth row of Pascal's triangle. The degree of \(a\) will start at n and descend by 1 each term while the degree of \(b\) will start at 0 and ascend by 1 each term. Using Pascal's triangle to complete a binomial expansion takes out the labor needed for higher values of n. Instead of having to multiply binomials and combine like terms, one can simply look at the appropriate row of Pascal's triangle and quickly write out the expansion. The binomial theorem written out is as follows: \[(a+b)^n = a^n + na^{n-1} + \frac{n(n-1)}{2!}a^{n-2}b^2 + \frac{n(n-1)(n-2)}{3!}a^{n-3}b^3 + ...+ b^n\] Use this applet to explore how Pascal's triangle applies to the binomial theorem! \(a\) and \(b\) will change the two values in the binomial while \(n\) will change the degree of the binomial.
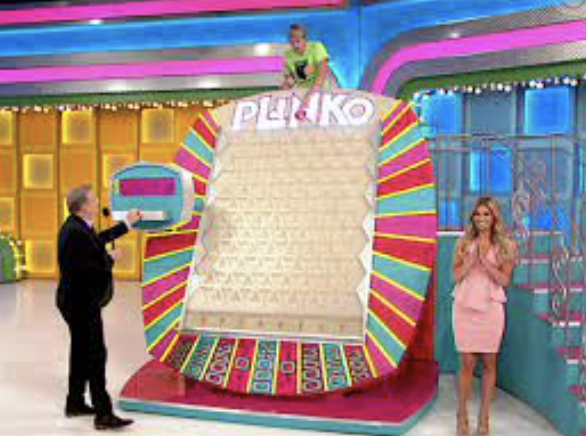
A more fun place that Pascal's triangle is found is in the game Plinko! Plinko was first introduced on the game show the Price is Right, and contestants had to drop chips onto a board. The board was filled with pegs, and as the chip fell through the pegs it would be directed into one of many bins that contained different prizes.
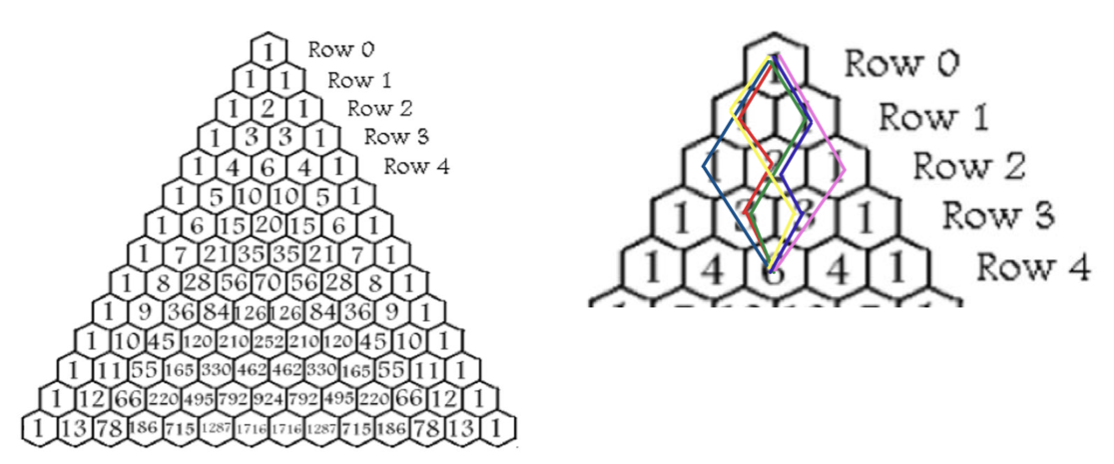
When a chip is dropped it hits a peg. After hitting a peg it will either bounce to the right or to the left where it will hit another peg and similarly bounce either right or left again. This pattern of hitting pegs and bouncing a certain direction continues until the chip has reached the bottom of the board. A mathematician watching this game may be interested in analyzing the different paths a chip can take and the associated probabilities with each bin. This is where Pascal's triangle comes into play! If we associated each entry in Pascal's triangle with a bin at the end of the plinko board, each entry would represent the number of paths that lead to that specific bin. From the image below, the "6" in row four would indicate that there are six unique paths from the top of the triangle that lead to that entry. The image on the right shows each of the six paths highlighted by a different color.
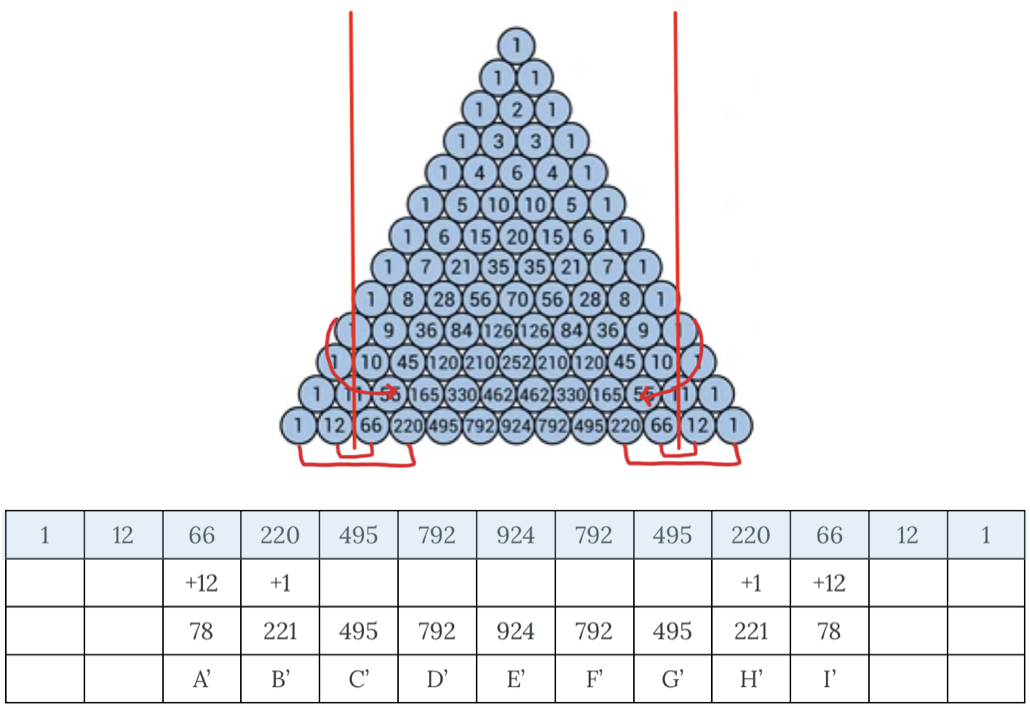
However, it is important to note that a plinko board is not shaped exactly like a triangle. It is a rectangular board that is thirteen rows long and nine bins across. The thirteenth row would actually be row 12 (because Pascal's triangle starts at row zero) and has thirteen entries, not nine. Is Pascal's triangle still applicable given this knowledge? It is! This is because in the game of plinko, chips can bounce off the sides of the rectangular board. To get new counts that accurately reflect the number of paths that lead to that entry, one just has to do a bit of simple math. Marasco and Assefa explain the table below by sharing "The 12 that is added to the 66 and the 1 that is added to the 220 account for the chips bouncing off the sides, and we show this mathematically by creating a fold on Pascal's Triangle after the 66's in row 13. Think of this as physically folding the left side of the triangle on the rest of the triangle with a fold line on the vertical line between the 12 and the 66. Then note that the 12 lines up with the 66 and the 1 lines up with the 220. The same process can be done on the right side of the triangle where physically the right side of the triangle is folded on rest of the triangle" (2020).
This math is accurate for when the contestant drops the chip from the middle of the board. Suppose the contestant instead drops the chip in any of the other slots at the top. Again, Pascal's triangle does not become useless! Just as we "folded" the triangle to adjust for the number of bins along the bottom of the board, you would simply "fold" Pascal's triangle to adjust for the new placement of the chip. The top of the triangle would line up with the placement of the drop and then "fold" the edges as necessary to line up with the edges of the board.
The following video by Michael Stevens gives a good representation of both the binomial expansion as well as the plinko math that was just discussed. In addition, he goes over some more cool properties of Pascal's triangle!
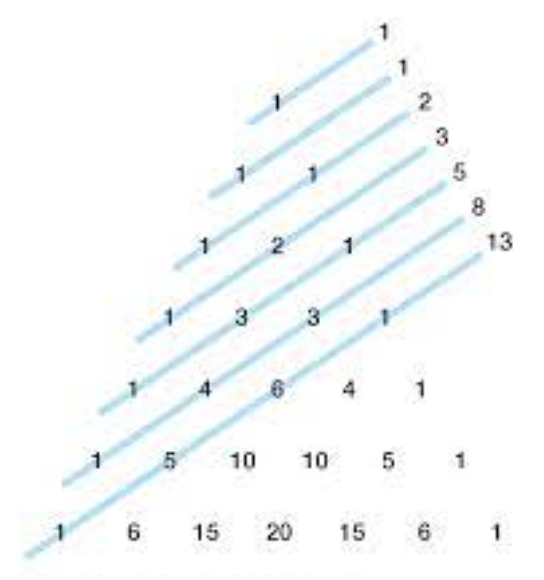
One of his observation covers the diagonals of Pascal's triangle. Diagonals are when you start at an entry on the left edge of the triangle, and draw a line that passes through entries up and to the right (pictured below). If you add up the diagonals throughout the triangle, you will be left with the Fibonacci sequence! A short explanation of the Fibonacci sequence is that you start with the number one and obtain the next number by adding the two before it (D!NG, 2018).
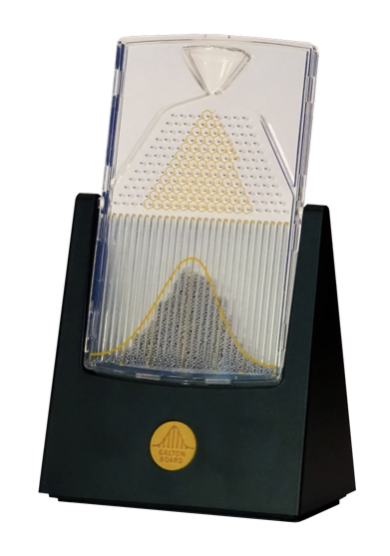
Stevens also goes over an explanation of how the Galton board (pictured below) illustrates a Normal curve. As he flips the structure over, all of the balls fall down through the pegs (much like plinko) and create a very good approximation to the Normal curve. Pascal's triangle can be used to visualize why this happens. In each row, the edge entries start at one and increase in size until the biggest entry is in the middle. As discussed with the plinko board, these numbers represent the number of paths that lead to that specific entry. We can also represent this number as a probability instead of a count. For example, in row three the numbers all add up to eight. So we could say that there is a \(\frac{3}{8}\) chance of a chip/ball making it to either of the threes in that row. In general for each row, the largest probability will be in the center with decreasing probabilities as you move towards the edges. So with the Galton board, we would expect to see the most balls in the center with fewer and fewer balls as you move away from the center. This explains why we see the Normal curve if we simulated a sample of plinko chips or balls in the Galton board.
The following applet demonstrates what is happening when a Galton board is flipped over. The intro setting allows
you to explore dropping balls down pegs and observing their distribution, while the lab setting allows you to change features
about the board and see descriptive statistics.