Social Sciences
Interpersonal Relationships
In the social sciences, like psychology, history, government, etc., they often look at the relationships between people, called interpersonal relationships
(Wilson,1982)
. Most often the vertices correspond to the individuals, and the edges respond to the relationships between the individuals.
These can be directed or undirected, meaning that the relationships can go both ways, were the individuals like, hate, agree, disagree, with each other, or
it can go one way. For our purposes, consider only relationships that are mutual, and thus undirected. Using + and - to denote the relationships like and dislike.
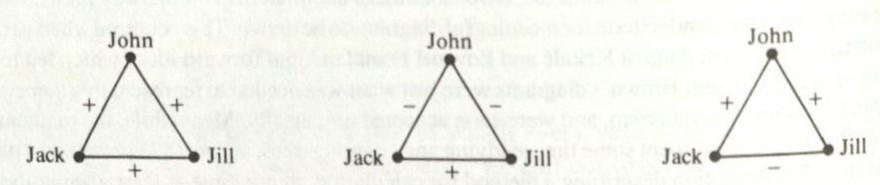
Take a look at the three graphs below, which graph do you think would cause the most tension between the group members, John, Jack, and Jill? Suppose they have a
group project they have to do for a class.
The first graph, all three group members like each other, thus there would be no problems. The second graph, Jack and Jill like each other and dislike John.
Jack and Jill would work together and exclude John from the group. The third graph, John likes both Jack and Jill, but Jack and Jill do not like each other.
In this scenario, John would try to work together with both Jack and/or Jill but would most likely end up doing all the work himself. The third group would be
the one that causes the most tension.
Chronological Ordering
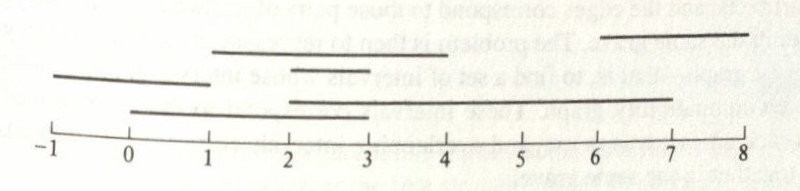
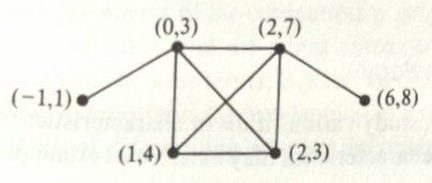
Another area that is often used in social studies is chronological ordering. This is often used in history, English, psychology, and archeology. Chronological
ordering uses interval graphs to help them determine overlaps. Below is an example of an intervals on a number line and the graph associated with it. The graph
is a compatibility graph. Note that every interval graph is a compatibility graph, but not every compatibility graph is an interval graph (Wilson & Watkins, 1990)
.
To help you understand how they are used, here are a few examples in the fields of archeology, developmental psychology, and English.
Archaeologists often want to find the dates of when people were alive. This can also correspond to history. The way they do this is by looking at pottery, writing,
or other artifacts found in graves. If two of the artifacts occur together, in the same grave, then most likely, their time periods would have overlapped. This
process is often called sequence dating or seriation. If a graph is made, such that the vertices are the artifacts, and the edges represent whether two artifacts are
in the same grave, we get a compatibility graph. The problem is then making an interval graph from this compatibility graph. In English, they often use the same process as archaeologists
for find the dates and/or ordering of when certain classical works (like Shakespeare's plays) were published.
In developmental psychology, interval graphs are used to find when traits or characteristics show in children, adolescents, and adults. It helps them to be able
to answer the questions like, when can be expect a child to start walking, when can we except an adolescent to hit puberty, etc. They can observe many children
over time and note when certain characteristics show. Then they can make a compatibility graph, and then interval graphs, thereby making it possible to answer
the above posed questions.